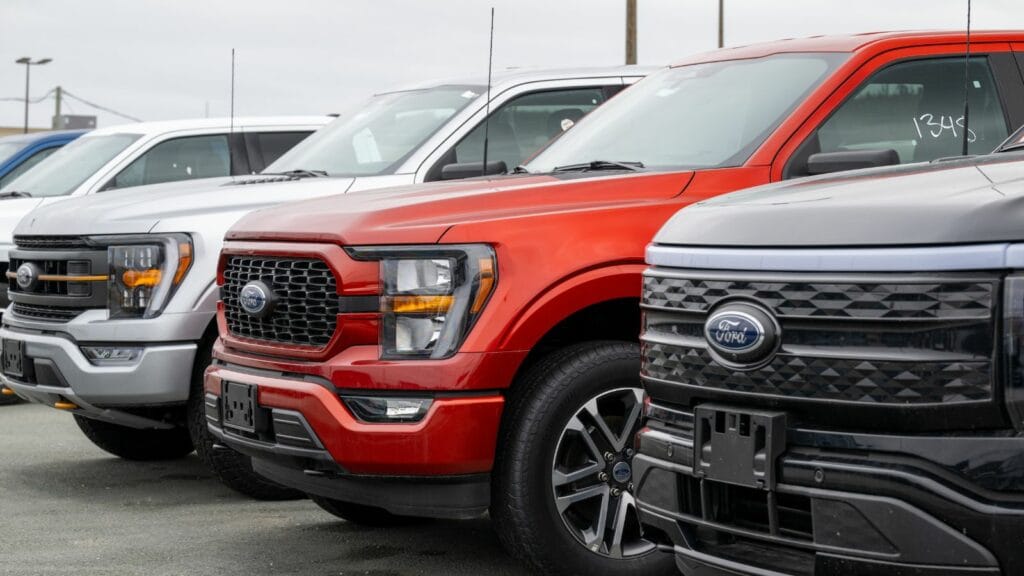
Canada’s automotive market is showing a noticeable shift in vehicle availability, but greater inventory does not necessarily mean lower prices. New dealership tracking data reveal nearly 420,000 vehicles advertised across the country, with enough inventory to represent approximately 85 days of supply at the recent pace of vehicles leaving dealership websites.
According to DealerProxy.ca’s early November 2026 figures, the tracker covers more than 3,100 Canadian dealerships, providing a detailed picture of vehicle availability, asking prices, inventory turnover, and dealer price reductions.
The findings highlight an increasingly complicated market for buyers and retailers. Some brands are moving vehicles quickly, while others have several months of inventory available. Meanwhile, regional differences and persistent affordability pressures suggest that Canada’s growing vehicle selection may not translate into better deals for everyone.
What the Nearly 420,000-Vehicle Count Actually Represents
The latest DealerProxy snapshot provides an unusually detailed look at the vehicles Canadian dealerships are advertising. As of November 2, the platform was monitoring 3,254 dealerships, including 3,122 with listed inventory. Approximately 419,748 vehicles appeared in the database, with 406,284 carrying advertised asking prices. The count includes new and used vehicles rather than exclusively factory-fresh inventory. DealerProxy gathers information from dealership websites and attempts to count each vehicle only once, even when it appears in multiple dealership listings. That distinction matters because the national total does not represent 420,000 unsold new cars. Instead, it reflects a substantial cross-section of available dealership inventory across different vehicle ages, price brackets, brands, and provinces.
There are important limitations to the findings. DealerProxy began tracking vehicles on September 20, 2026, meaning its historical database remains relatively young. Coverage expanded rapidly during the initial weeks, so some early increases in recorded inventory reflect additional dealerships entering the system rather than a sudden wave of vehicles arriving at Canadian lots. The figures also represent participating websites, not an independently audited census of every vehicle available nationally. For consumers, however, the platform offers an increasingly useful way to understand local availability and pricing. A buyer searching for a specific SUV can compare advertised options, while dealers can examine how their inventory compares with competing retailers. The underlying information is valuable, provided the figures are interpreted as an evolving market snapshot rather than a complete accounting of Canada’s automotive supply.
Why 85 Days of Supply Matters for Canada’s Auto Market
One of the tracker’s most revealing measurements is its estimate of 85 days of vehicle supply. The calculation compares the number of currently advertised vehicles against the pace at which vehicles disappeared from dealership websites during the previous 30 days. In the November 2 snapshot, approximately 147,574 vehicles had left tracked listings during that period. Dividing available inventory by the average daily rate of departures produces an estimated 85 days of supply. Essentially, the figure indicates how long the existing stock might last if no additional vehicles arrived and the recent pace remained unchanged. It provides an indication of inventory turnover, particularly when comparing regions or manufacturers that have very different numbers of vehicles available.
However, 85 days of supply should not be confused with the time an individual vehicle spends waiting for a customer. Some popular models can disappear from dealership websites within days, while less desirable configurations may remain advertised substantially longer. There is another important distinction: a vehicle disappearing from a website is not definitive proof that it was sold. Dealerships may transfer vehicles, withdraw advertisements, or relist inventory under different identification numbers. DealerProxy acknowledges these possibilities in its methodology. Consequently, its supply estimate is best understood as a measure of observed listing activity rather than an official count of retail transactions. It can help identify emerging inventory pressure, but it cannot establish that dealerships will take exactly 85 days to sell every vehicle currently available.
Ontario Leads Vehicle Listings, but Quebec Has Faster Inventory Turnover
Ontario represents the largest share of vehicles captured by the national tracker, with approximately 151,422 listings across 1,087 dealerships. That accounts for roughly 36% of all vehicles appearing in the system. Quebec follows with approximately 88,730 vehicles advertised through 780 dealerships. Together, the two provinces account for well over half of the platform’s inventory. Despite Ontario’s larger total, Quebec’s vehicles appear to move through the system more quickly. DealerProxy estimated approximately 88 days of supply in Ontario compared with just 67 days in Quebec. The difference suggests a stronger rate of vehicle departures relative to available stock in Quebec, although it does not necessarily mean individual dealerships there are experiencing higher profits or stronger sales across every model category.
Western Canada presents a different picture. Alberta had approximately 55,833 vehicles listed, representing roughly 99 days of supply, while British Columbia’s approximately 54,832 advertised vehicles translated into 96 days. Saskatchewan stood out with about 111 days of supply across more than 16,000 listings, suggesting slower overall turnover relative to its tracked inventory. Meanwhile, Manitoba registered approximately 89 days, and New Brunswick was considerably lower at 75 days. These differences demonstrate why a single national inventory figure cannot describe conditions everywhere. A dealership in Edmonton may face different competitive pressures than one in Montreal, even when advertising similar vehicles. For buyers, provincial averages are useful starting points, but local inventory, vehicle specifications, transportation costs, and dealer-specific pricing ultimately determine whether an attractive deal is available.
New Vehicles Dominate Dealership Inventory, but Prices Remain Elevated
One particularly important finding is the large proportion of new vehicles appearing in Canadian dealership inventories. Approximately 68% of Ontario’s tracked listings were classified as new vehicles, compared with nearly 59% in Quebec, 69% in Alberta, and 65% in British Columbia. Manitoba’s new-vehicle share approached 74%. These figures suggest that shoppers have substantial access to current-model inventory across several major markets. However, the available selection remains expensive. Median new-vehicle asking prices reached approximately $54,605 in Ontario, $49,530 in Quebec, $60,474 in Alberta, and $53,093 in British Columbia. These are advertised prices, not confirmed selling prices, and differences between provinces can reflect the types of vehicles dealerships carry rather than price differences for identical models.
Broader sales statistics help explain why substantial inventories can coexist with high vehicle prices. Statistics Canada reported 174,611 new vehicles sold nationally in August 2026, representing a 4.9% increase compared with August 2025. The total dollar value of those sales increased by an even larger 8.8%, indicating that spending grew faster than the number of vehicles purchased. Meanwhile, AutoTrader’s second-quarter 2026 Price Index reported average new-vehicle prices falling 2.2% and used-vehicle prices declining 2.6%, although affordability remained a major concern. For households balancing mortgage payments, groceries, insurance, and transportation expenses, a modest reduction in sticker prices may not change whether a new vehicle fits the budget. The market appears increasingly capable of supplying vehicles, but the challenge of making them financially accessible remains significant.
Dealership Price Cuts Reveal Growing Competition for Buyers
Price reductions are another major feature of the new inventory data. DealerProxy recorded approximately 188,000 price-cut events during its latest 30-day measurement period, suggesting that dealerships are actively adjusting their advertised prices. In Ontario, approximately 22% of tracked listings showed a reduction from their initially observed asking prices. Quebec was close to 23%, while Alberta approached 29% and British Columbia roughly 27%. The typical size of these reductions also varied. Median recorded cuts were approximately 2.9% in Ontario and Quebec, compared with 3.5% in Alberta and British Columbia. These percentages may seem modest, but even relatively small reductions can influence purchasing decisions when vehicles carry asking prices of $40,000, $50,000, or more.
The numbers require some caution because a reduction in an advertised price does not establish that a vehicle has sold at a discount or that every dealership is under financial pressure. Price changes can reflect ordinary inventory management, adjustments to competitive listings, or efforts to attract shoppers to particular models. Differences between brands are especially revealing. Approximately 38% of Mazda’s tracked listings had experienced price reductions, but the median reduction was only 0.9%. Ford had a lower share of reduced listings, around 26%, yet its median cut was considerably larger at 4.1%. This suggests that the frequency of price reductions and their financial significance can tell different stories. Consumers comparing vehicles should examine the actual dollar savings, financing conditions, and final purchase price rather than assuming that every advertised markdown represents an exceptional opportunity.
Toyota and Honda Show Faster Turnover Than Some Competing Brands
The national average conceals major differences between vehicle manufacturers. Toyota had approximately 21,714 vehicles in the tracker and an estimated 54 days of supply, considerably below the national figure. Honda’s approximately 28,444 listings translated into around 70 days, while Ford’s much larger inventory of nearly 56,800 vehicles represented approximately 79 days. Jeep presented a different picture, with roughly 20,647 vehicles listed and approximately 130 days of supply. These differences matter because inventory that moves quickly places different pressures on dealerships than vehicles that remain available for several months. A brand with a high inventory count is not necessarily struggling if vehicles are consistently leaving its lots at a strong pace.
Individual models reveal another layer of activity. The Ford F-150 accounted for approximately 6,725 vehicles disappearing from tracked dealership websites during the preceding 30 days, while the Toyota RAV4 recorded around 2,091 departures and the Honda CR-V approximately 3,016. These figures reflect observed listing turnover, not independently confirmed sales. They nevertheless illustrate why popular vehicles can maintain substantial inventories while continuing to move through dealership networks. Customers should not automatically expect the same negotiating flexibility on every model simply because national supply appears elevated. A heavily stocked pickup, a highly sought-after hybrid SUV, and an expensive luxury vehicle may each face different competitive conditions. The tracker also contains some inconsistent brand labels, including separate entries for RAM and Ram, reinforcing the importance of examining specific models rather than treating manufacturer-level totals as perfectly standardized.
Used-Vehicle Inventory Is Growing, but Prices Are Not Falling Equally
Canada’s used-vehicle market provides additional evidence that growing inventory does not automatically produce dramatic price declines. According to CARFAX Canada’s October 15, 2026, market update, used-vehicle inventory reached 228,788 distinct listings in August, an increase of 18.9% from the previous month. That represented the highest inventory level recorded in its dataset during 2026. However, the average used-vehicle listing price remained relatively stable at $30,776, down just 0.3% month over month and 2.7% compared with August 2025. Meanwhile, used-vehicle transactions declined 6.6% from a year earlier. The figures suggest that supply was increasing while purchasing activity weakened, creating the conditions for greater pricing competition without necessarily triggering immediate, widespread discounts. CARFAX’s measurements use a different dataset and reporting period from DealerProxy, so their inventory totals should not be directly compared.
More recent wholesale data point toward additional pressure in certain used-vehicle categories. Canadian Black Book reported a 0.40% decline in wholesale vehicle values for the week ending October 24, 2026, including a 0.50% decrease for passenger-car segments and a 0.33% reduction for trucks and SUVs. Wholesale values reflect a different part of the market from retail asking prices, but changes can eventually influence how dealerships value trade-ins and price replacement inventory. For someone replacing an older family vehicle, the situation creates competing considerations. A larger selection may improve the chances of finding the desired model, but a declining trade-in value could offset some of the savings on the next purchase. Vehicle age, mileage, condition, and local availability remain important factors, meaning the national inventory increase may benefit some buyers considerably more than others.
What the Inventory Numbers Mean for Dealerships and Canadian Car Buyers
The latest tracking data arrive as dealerships continue adjusting to a changing market environment. AutoCanada, one of the country’s major dealership groups, reported that its new-vehicle inventory reached 79 days of supply during the second quarter of 2026, up from 76 days a year earlier. Its used-vehicle supply moved in the opposite direction, declining from 63 days to 54 days. These figures cannot be directly compared with DealerProxy’s national estimate because they cover different dealership populations, periods, and measurement methods. However, they reinforce the broader point that new and used inventory do not always move together. AutoCanada also identified elevated vehicle prices, financing costs, and economic uncertainty as factors affecting consumer demand. For retailers, managing inventory efficiently remains important, particularly when certain models are turning over much more slowly than others.
For Canadian consumers, the practical advantage of greater inventory is the opportunity to compare more vehicles and potentially negotiate from a stronger position. Still, the final cost of ownership deserves as much attention as any advertised discount. The Financial Consumer Agency of Canada provides an example involving a $25,000 vehicle financed at 5% interest. Over 36 months, the total cost reaches approximately $26,974, while extending the loan to 84 months increases the total to $29,681. That is an additional $2,707 despite the lower monthly payments associated with the longer term. Buyers should therefore compare financing rates, loan lengths, dealer fees, trade-in allowances, and the complete purchase price before making a decision. Canada’s nearly 420,000 advertised vehicles signal meaningful selection across the market, but the strongest purchasing opportunities will depend on where inventory is accumulating, which models dealers are discounting, and whether the final financing terms genuinely improve affordability.
